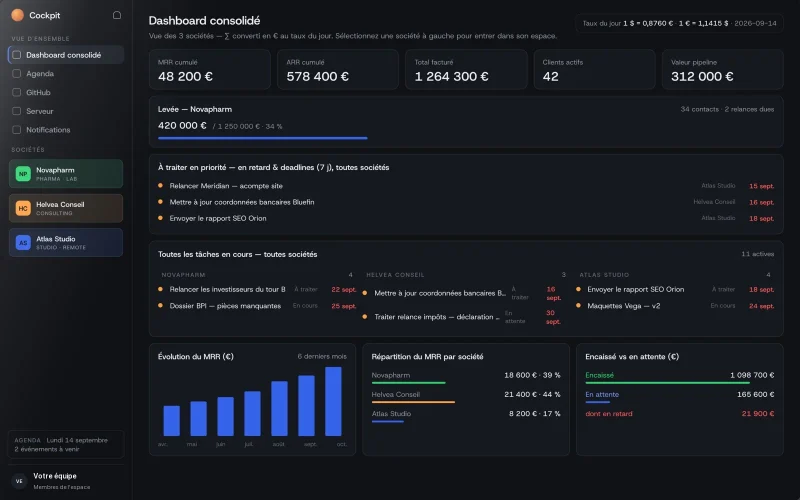



Dashboard consolidé
Vue des 3 sociétés — ∑ converti en € au taux du jour. Sélectionnez une société à gauche pour entrer dans son espace.
Missions
SaaS, custom internal tools and sites — delivered, in production, in the hands of real users. Have a look, then tell yourself: I want the same.
The problem
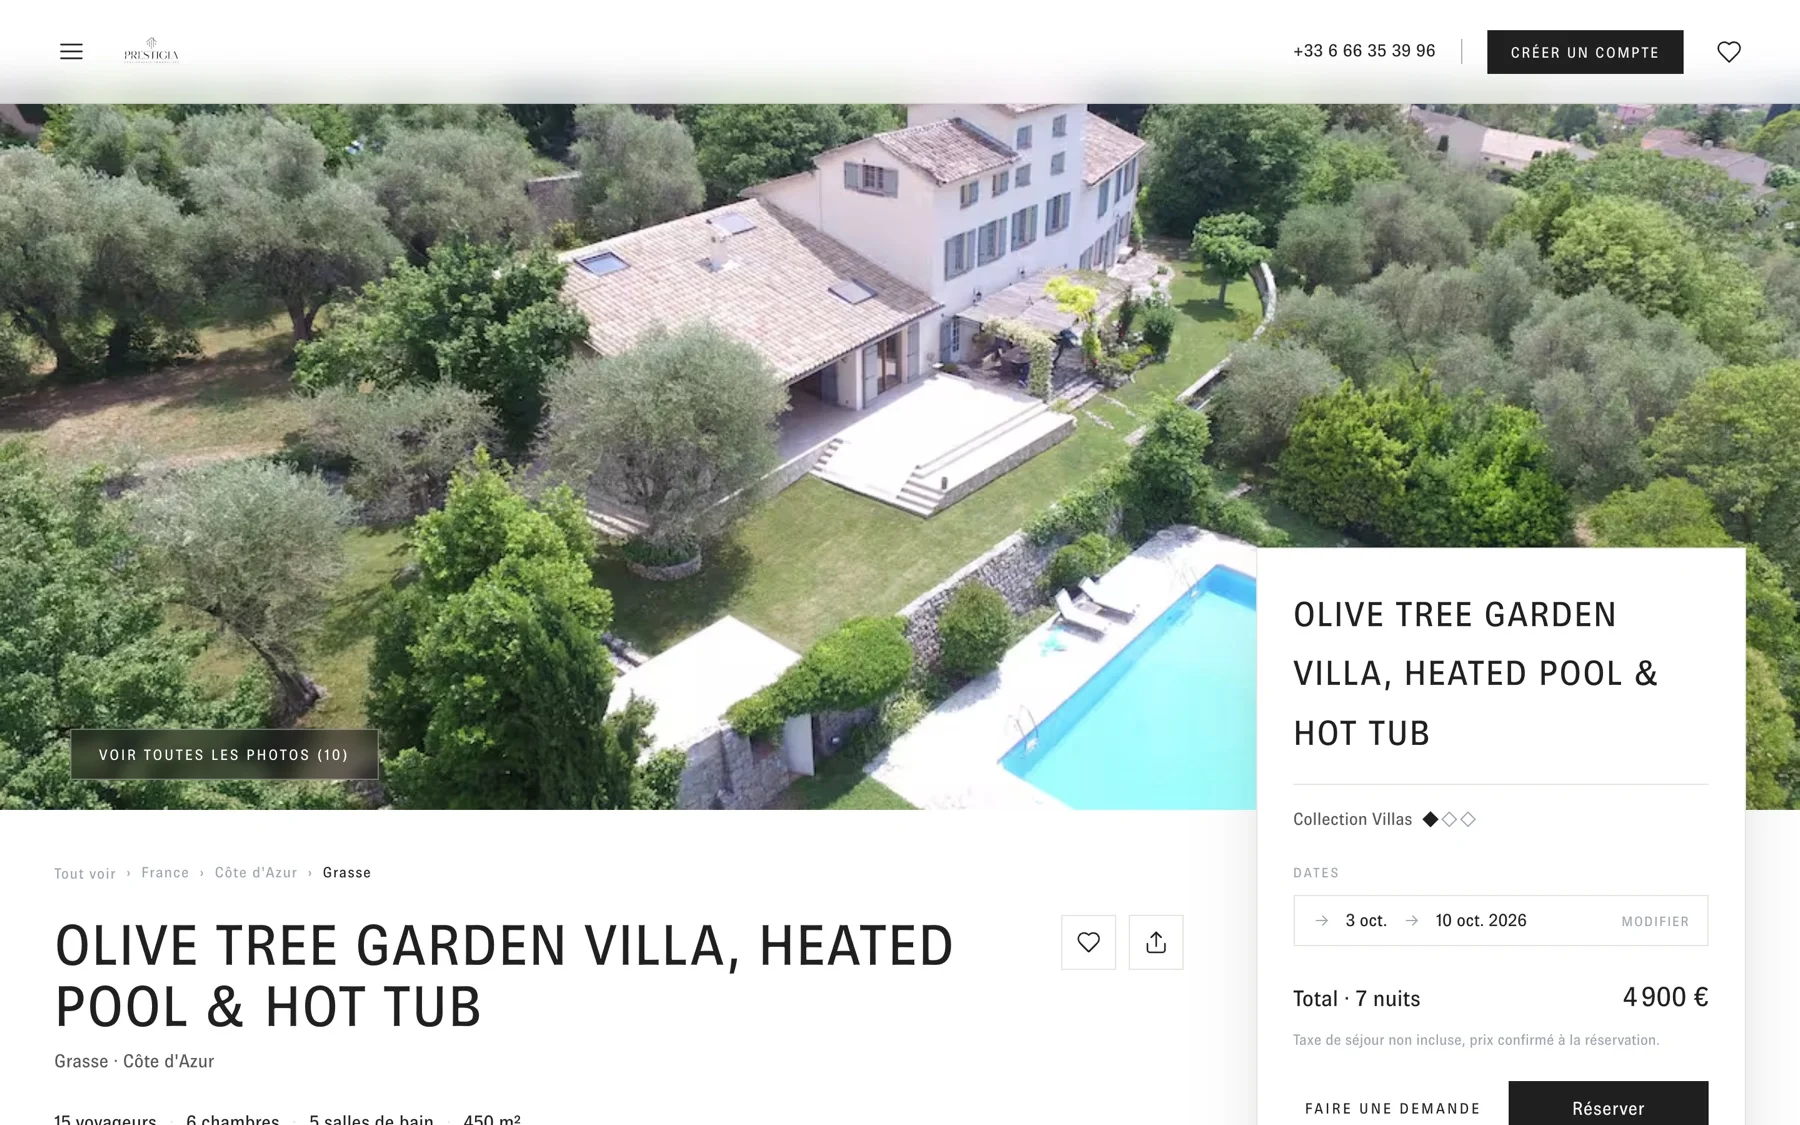
A real-estate concierge on the French Riviera, two audiences on one site: travellers looking for an exceptional address, owners entrusting their property. Listings that live in a booking engine, and an owner relationship that deserved a real space — their properties and documents in one place.
What we delivered
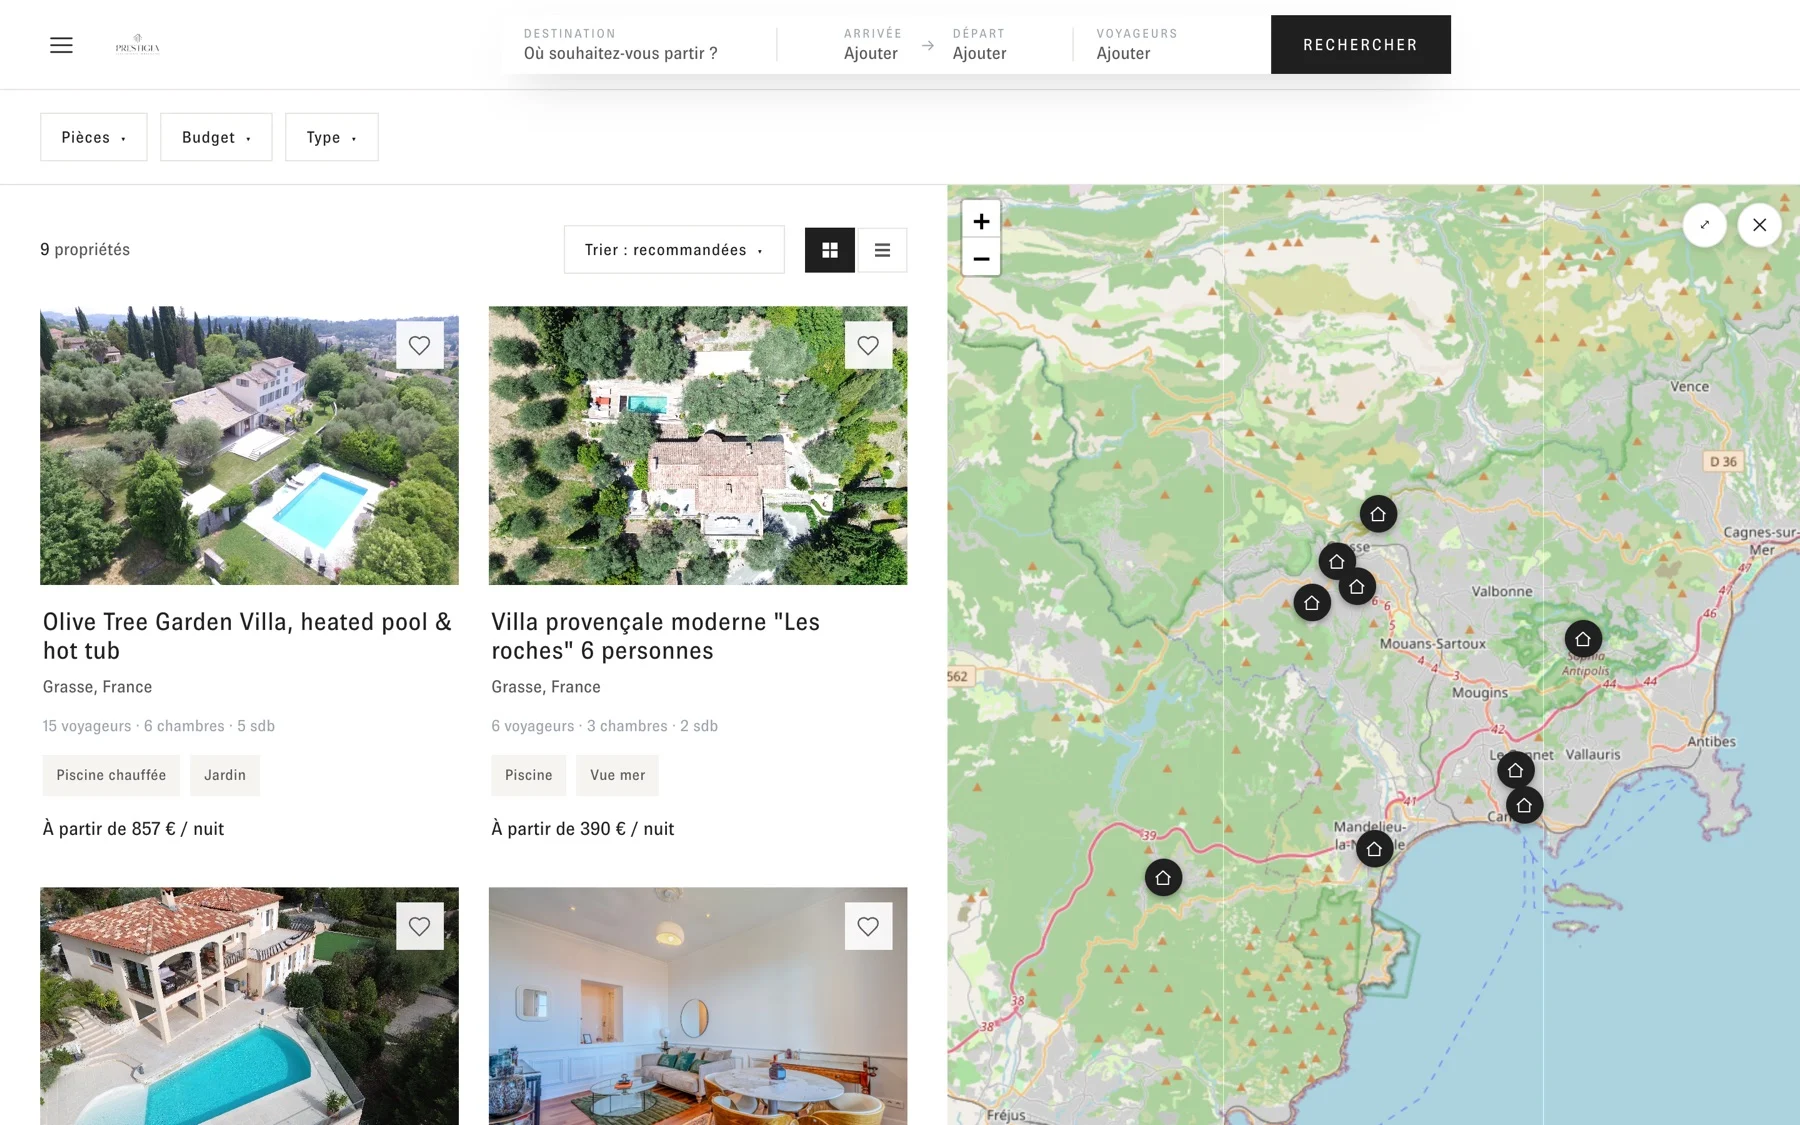
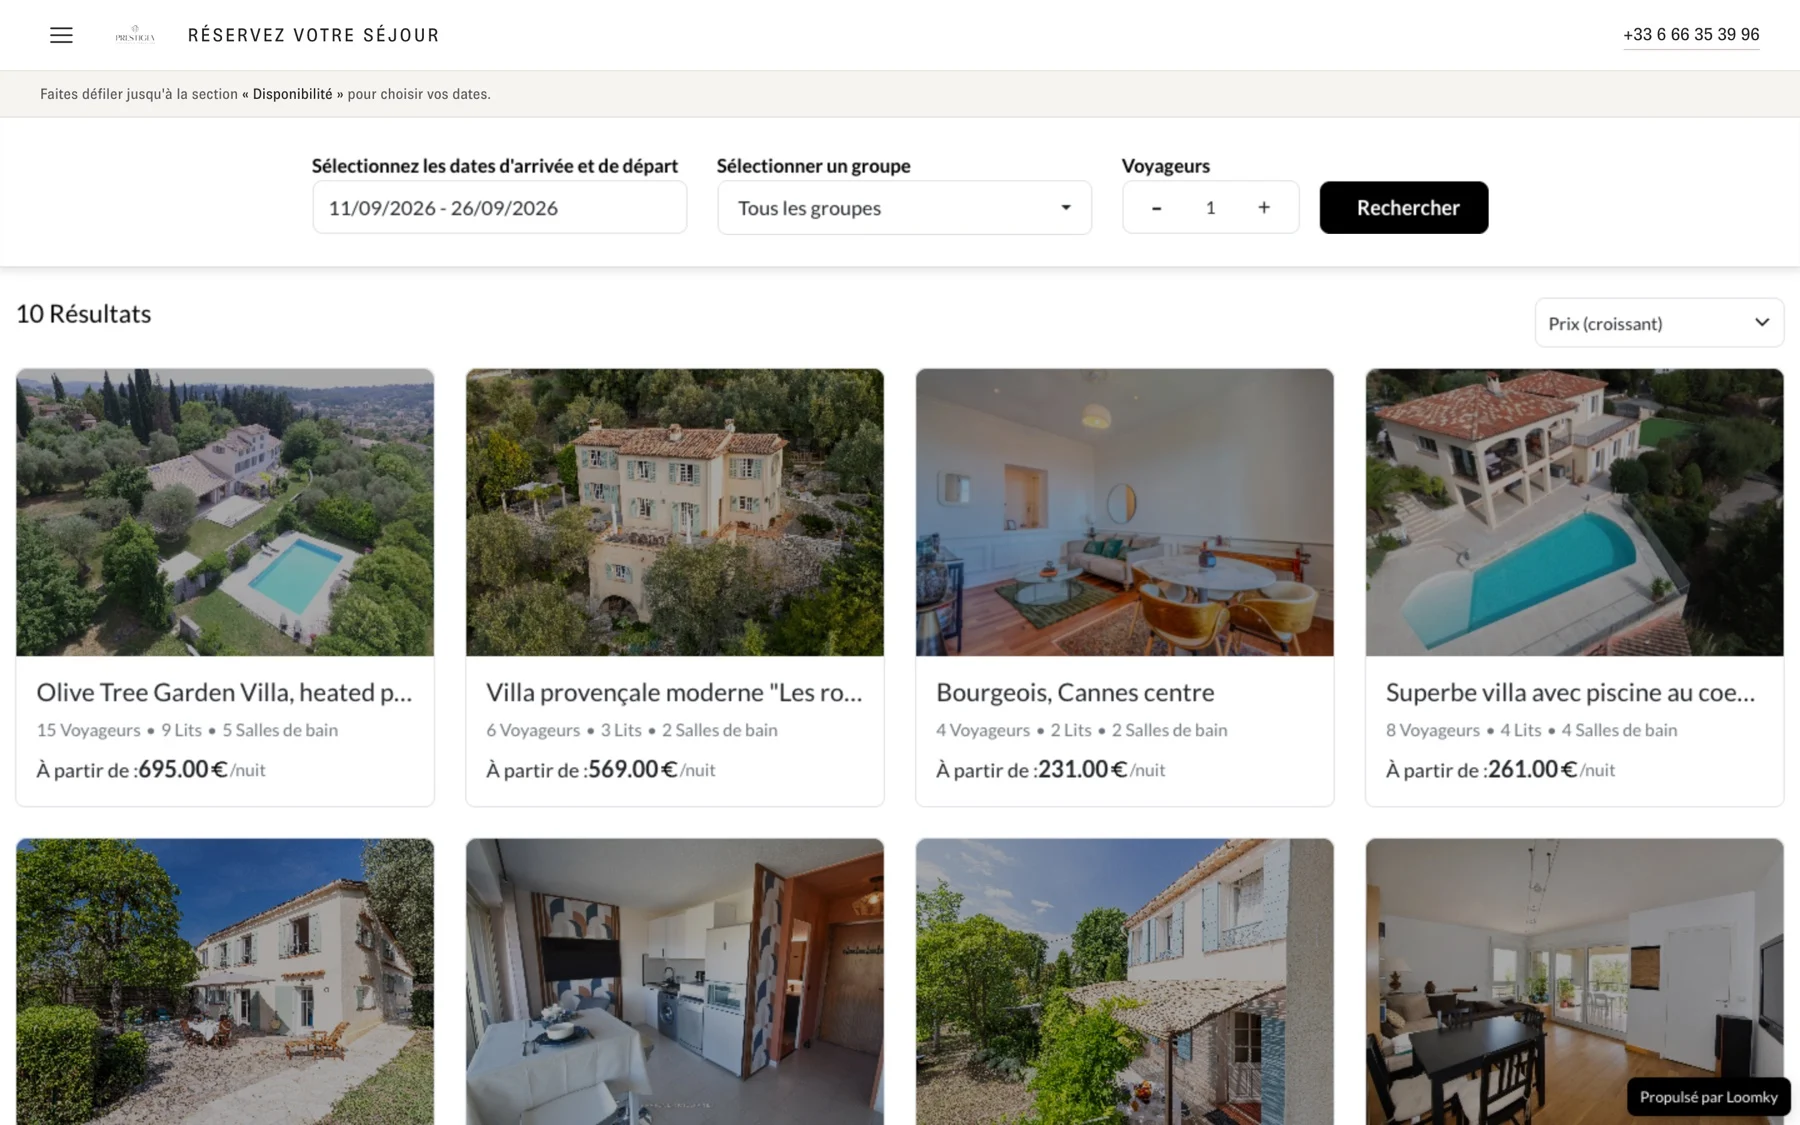
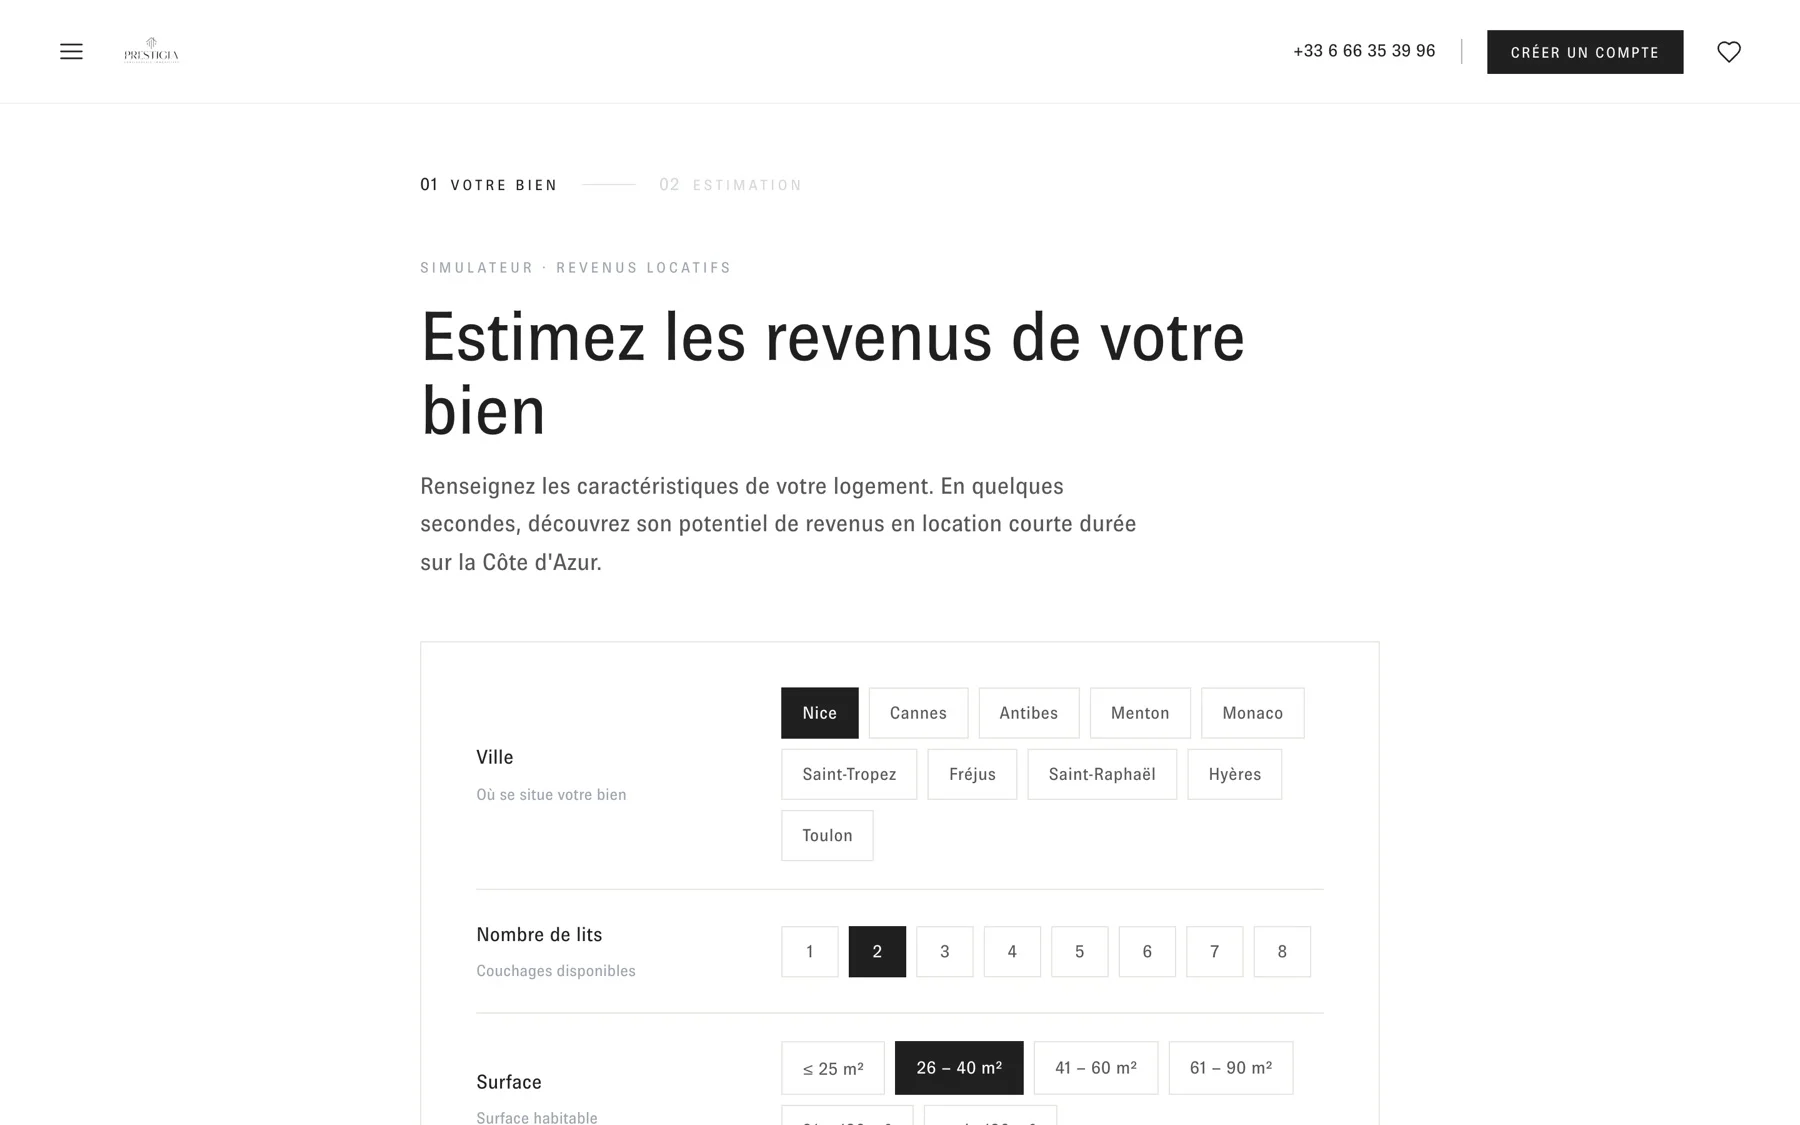
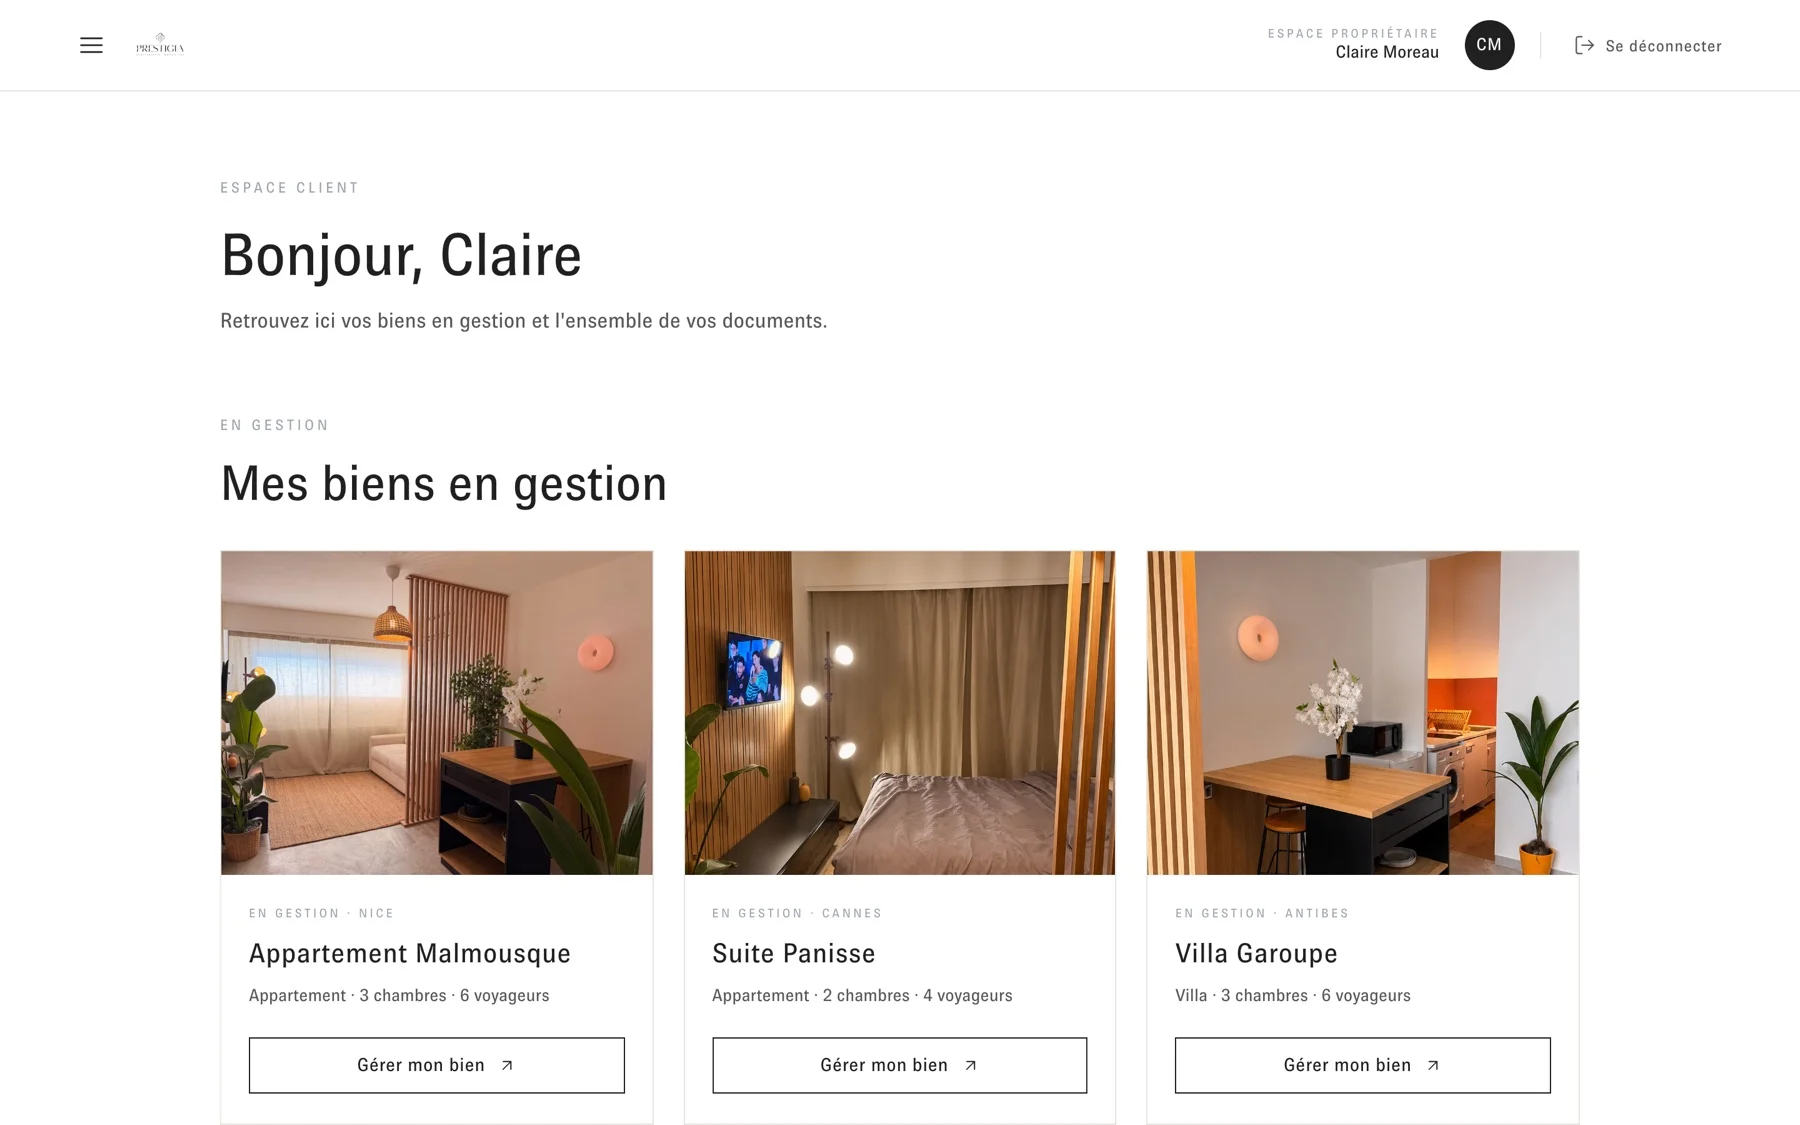
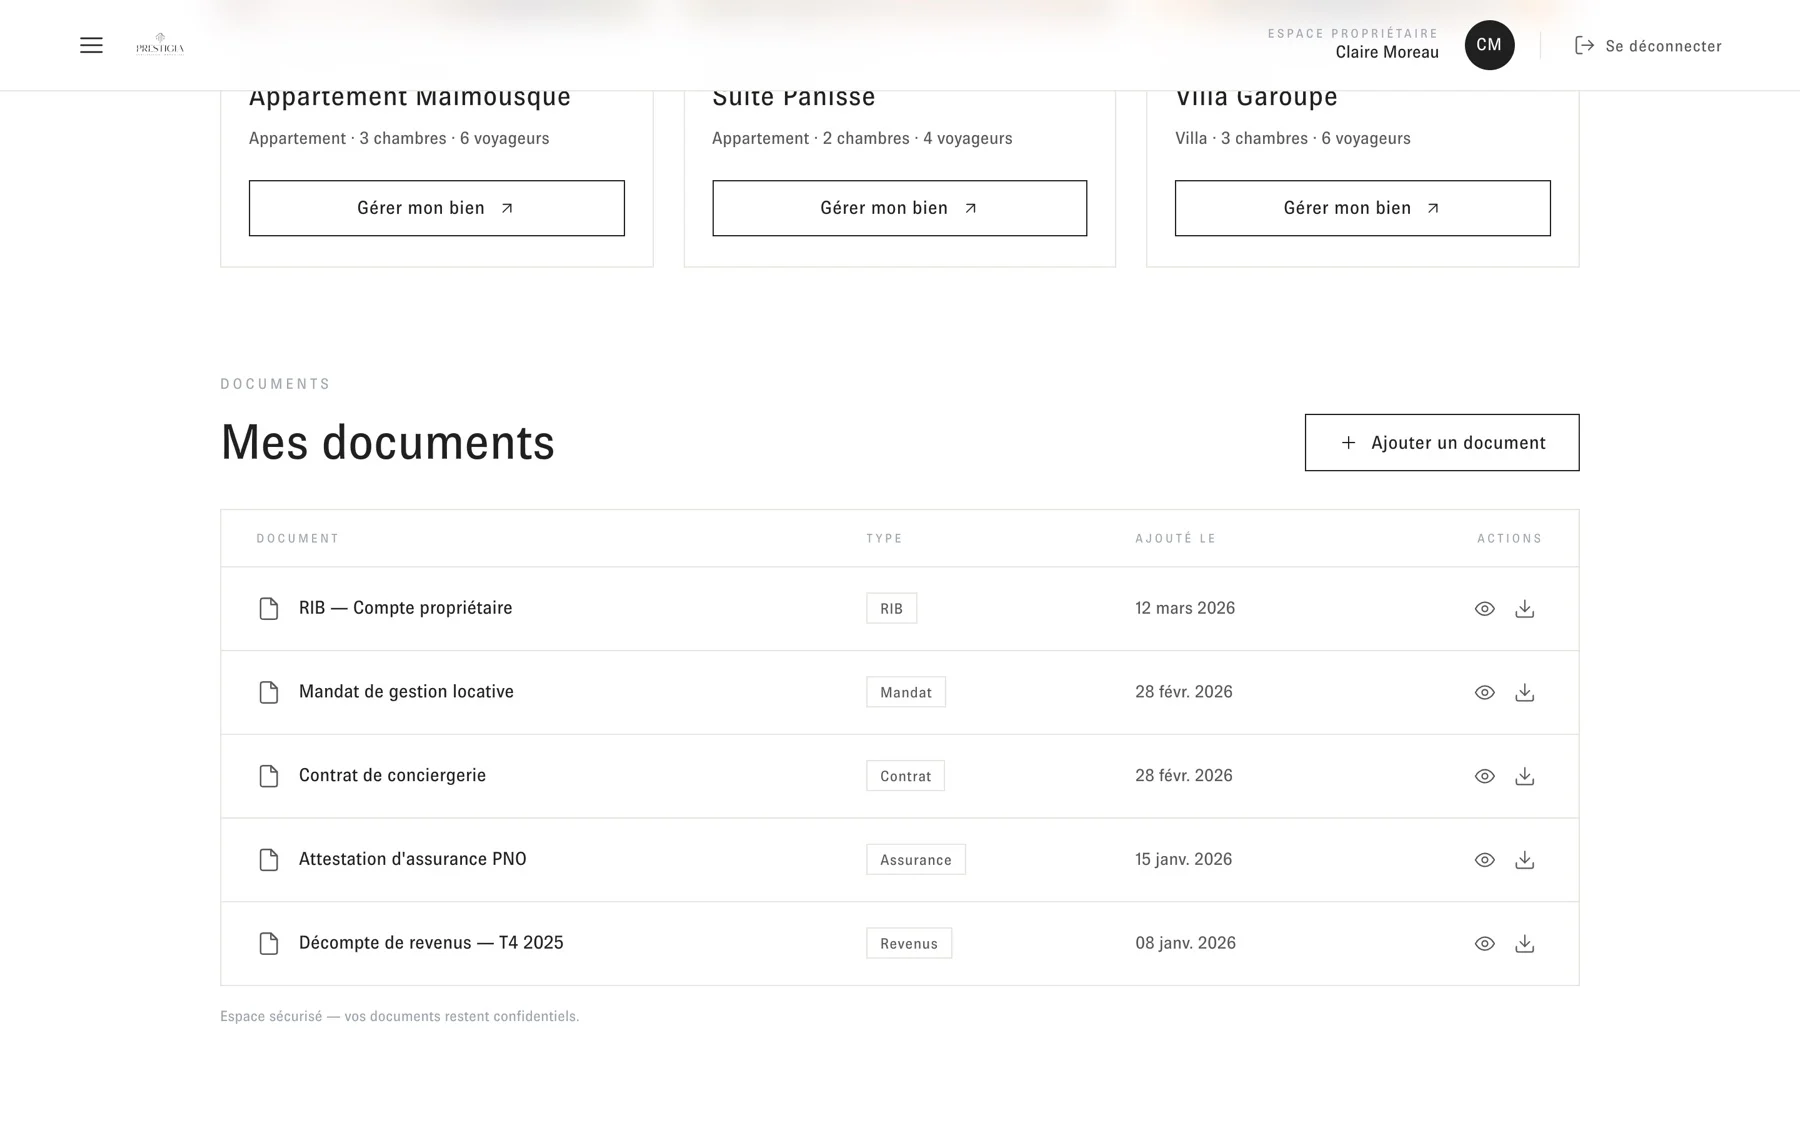
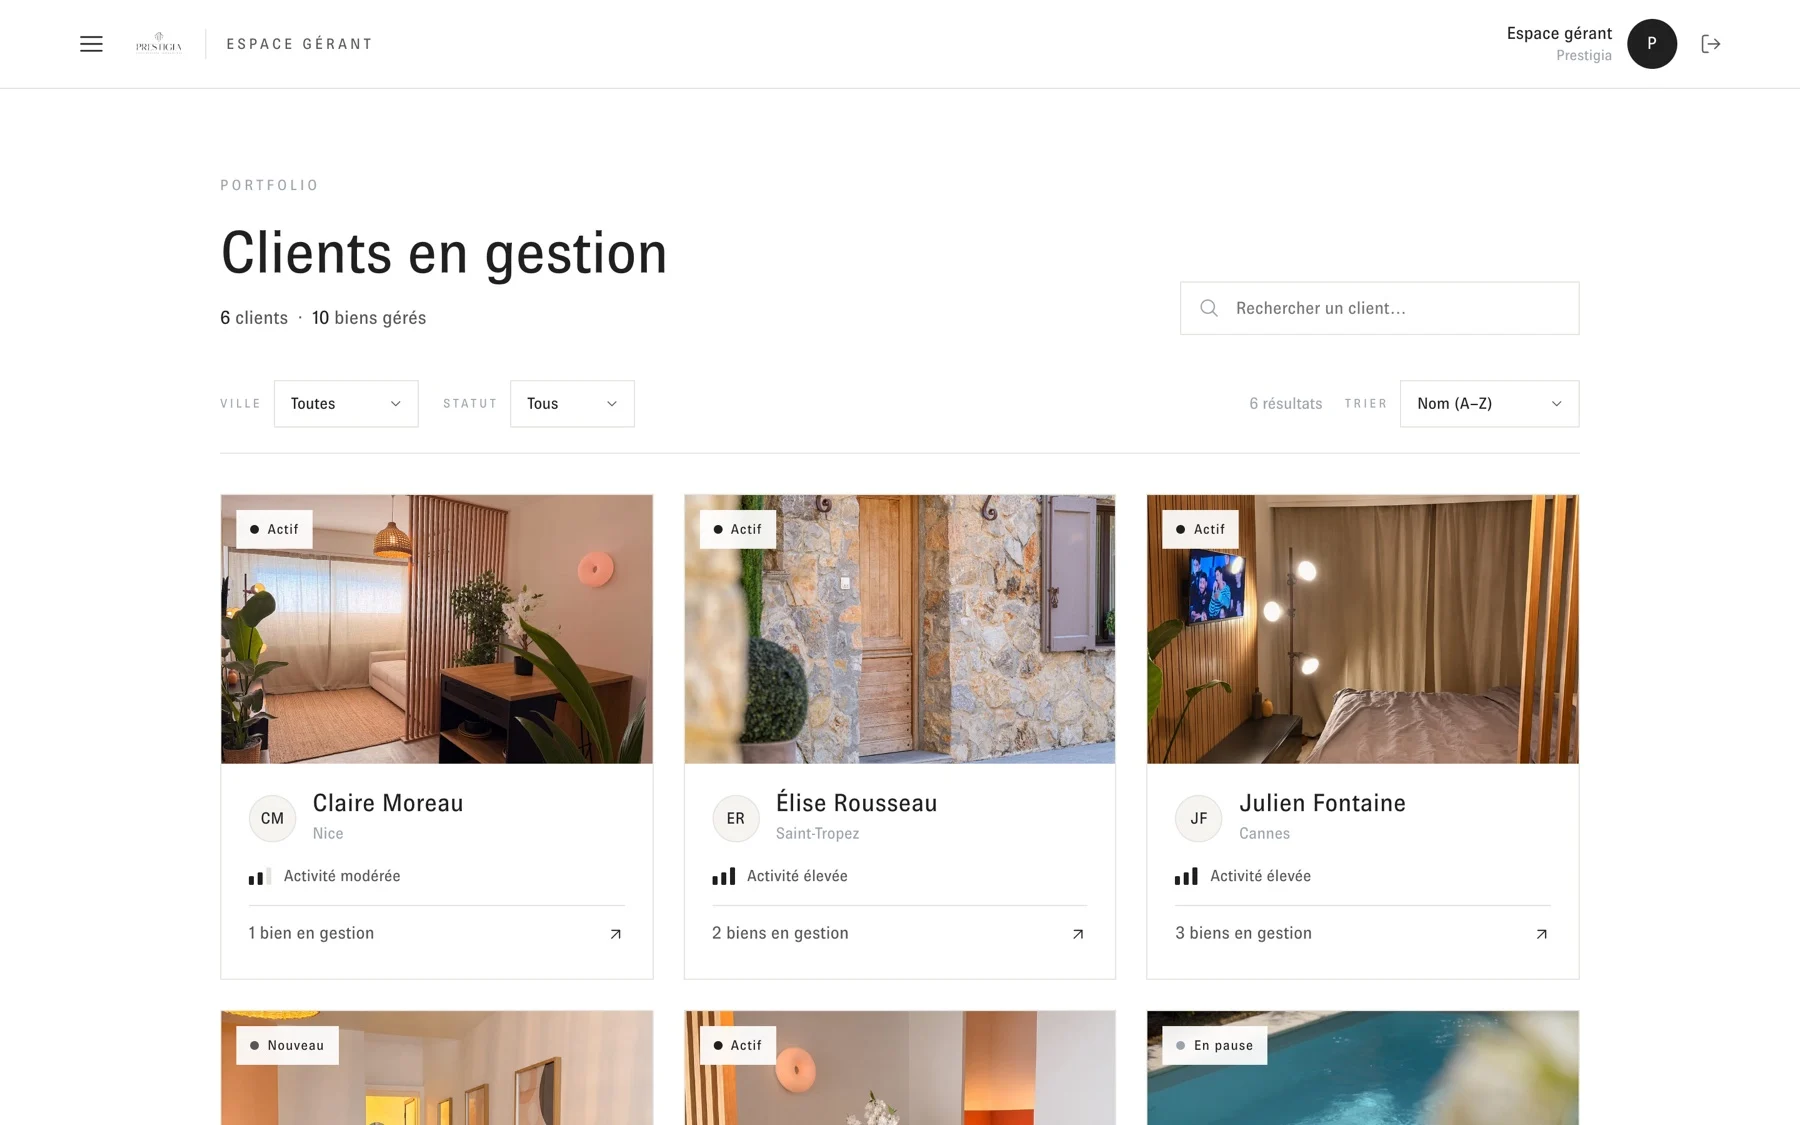
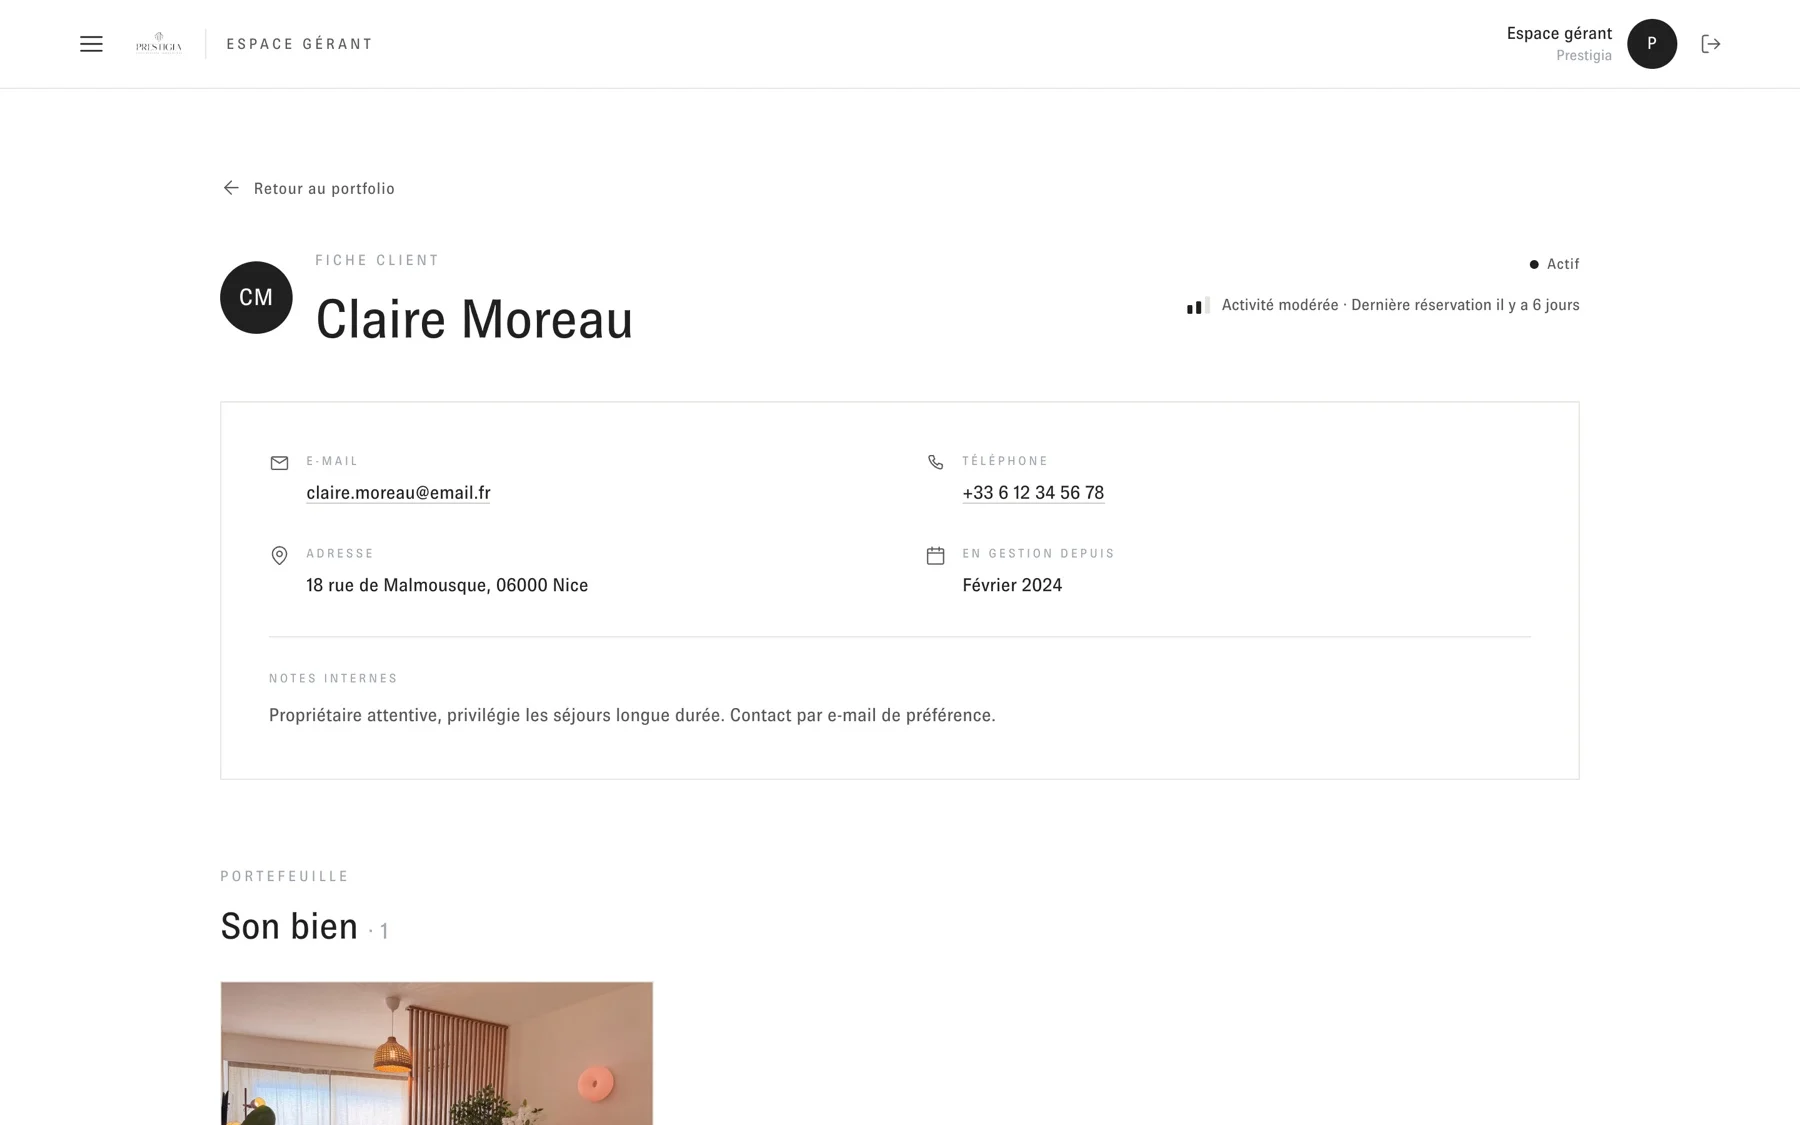
A complete site, in real code: a full-screen video storefront, property search on a map, listings and booking wired to the booking engine's real inventory, a rental-income simulator — and behind it, accounts. An owner space to find one's managed properties and documents; a manager back-office to run the client portfolio. Each owner sees only what is theirs.
Travellers
Owners
Manager


Full-screen video, search by destination, dates and guests — and the owner entry point right on the home page.Rooms, budget and type filters; every property pinned on the Riviera map, list and map side by side.Photos, amenities, collection, dates and stay total — fed by the booking engine’s real listings.Real availability and checkout on the booking engine, embedded in the site.City, beds, surface, range: a two-step rental-income estimate, then a call.Once signed in, each owner finds their managed properties — and nothing but their own.Documents filed by the concierge, to view and download; the storage is private, readable by the owner alone.The client portfolio: search, filters by city and status, managed properties per client.Contact details, seniority, internal notes, their properties and documents — this is where the manager files what the owner will see.
01 / 09What’s underneath
Who sees what
The result
In production at prestigiaconciergerie.fr. Listings are synced from the booking engine on every deploy: the site never lags behind the catalogue. Three roles — visitor, owner, manager — on a single database, with permissions enforced server-side.
M-002Custom internal tool · Multi-company control
The problem
Running several companies on Notion, Excel, a CRM and a billing tool means scattered data, double entry and no overview. Every figure needs a manual export.
What we delivered
We built Cockpit for ourselves: more than fifteen modules — CRM & pipeline, proposals and contracts, billing and payment schedules, VAT, P&L, cash flow, commissions, Google-Calendar-synced agenda, monthly SEO reports, GitHub tracking, blog — to run all our companies from a single interface. And whatever can run on its own does: eighteen scheduled jobs, from the morning invoices to the hourly SEO checks.
Control
Finance
Organisation
SEO clients
Vue des 3 sociétés — ∑ converti en € au taux du jour. Sélectionnez une société à gauche pour entrer dans son espace.
Vue de la société — MRR net, pipeline et total facturé.
Compte de résultat mensuel · base encaissement · USD · sans TVA
Réalisé (encaissé / décaissé) Mois en cours Projeté (prévisionnel)
| Catégorie | Janv | Févr | Mars | Avr | Mai | Juin | Juil | Août | Sept | Oct·prév | Nov·prév | Déc·prév | Cumul |
|---|---|---|---|---|---|---|---|---|---|---|---|---|---|
| ENTRÉES | |||||||||||||
| › Accompagnement / MRR | 11 200 $US | 11 200 $US | 12 400 $US | 12 400 $US | 13 100 $US | 13 800 $US | 14 850 $US | 14 850 $US | 14 850 $US | 14 850 $US | 14 850 $US | 14 850 $US | 163 200 $US |
| › Ponctuels | 18 000 $US | – | 42 500 $US | 9 800 $US | – | 61 200 $US | 24 300 $US | 17 900 $US | 8 600 $US | – | – | – | 182 300 $US |
| Total entrées | 29 200 $US | 11 200 $US | 54 900 $US | 22 200 $US | 13 100 $US | 75 000 $US | 39 150 $US | 32 750 $US | 23 450 $US | 14 850 $US | 14 850 $US | 14 850 $US | 345 500 $US |
| SORTIES | |||||||||||||
| › Abonnements | 1 860 $US | 1 860 $US | 1 920 $US | 1 920 $US | 2 140 $US | 2 140 $US | 2 310 $US | 2 310 $US | 2 310 $US | 2 310 $US | 2 310 $US | 2 310 $US | 25 700 $US |
| › Commissions versées | 2 900 $US | – | 6 400 $US | 980 $US | – | 9 200 $US | 3 600 $US | 2 700 $US | 1 300 $US | – | – | – | 27 080 $US |
| Total sorties | 4 760 $US | 1 860 $US | 8 320 $US | 2 900 $US | 2 140 $US | 11 340 $US | 5 910 $US | 5 010 $US | 3 610 $US | 2 310 $US | 2 310 $US | 2 310 $US | 52 780 $US |
| Résultat | 24 440 $US | 9 340 $US | 46 580 $US | 19 300 $US | 10 960 $US | 63 660 $US | 33 240 $US | 27 740 $US | 19 840 $US | 12 540 $US | 12 540 $US | 12 540 $US | 292 720 $US |
| Abonnement | Catégorie | Montant | Fréquence | Période |
|---|---|---|---|---|
| Assistant IA | Logiciels / SaaS | 980 $US | Mensuel | 2026-01-01 → en cours |
| Serveur | Logiciels / SaaS | 140 $US | Mensuel | 2026-01-01 → en cours |
| Hébergement des sites | Logiciels / SaaS | 220 $US | Mensuel | 2026-01-01 → en cours |
| Suite bureautique | Logiciels / SaaS | 310 $US | Mensuel | 2026-01-01 → en cours |
| Outil de design | Logiciels / SaaS | 180 $US | Mensuel | 2026-01-01 → en cours |
Trésorerie & suivi mois par mois — dépenses, catégories, TVA, abonnements, CA
Entrées réalisées Entrées à venir Solde Sorties réalisées Sorties à venir
| Poste | juil. 26 | août 26 | sept. 26 | Moy. | Total | Δ | Tendance |
|---|---|---|---|---|---|---|---|
| DÉPENSES | |||||||
| Dépenses TTC | 1 240 € | 9 860 € | 7 420 € | 6 173 € | 18 520 € | ▼ 25% | |
| Fournitures / Matériel | — | 5 180 € | — | 1 727 € | 5 180 € | ▼ 100% | |
| Salaires / Cotisations | — | — | 3 900 € | 1 300 € | 3 900 € | — | |
| Repas / Restauration | 210 € | 1 640 € | 820 € | 890 € | 2 670 € | ▼ 50% | |
| Logiciels / SaaS | — | 760 € | 1 290 € | 683 € | 2 050 € | ▲ 67% | |
| Carburant | — | 610 € | 510 € | 373 € | 1 120 € | ▼ 17% | |
| Télécom / Internet | — | 320 € | 300 € | 207 € | 620 € | ▼ 3% | |
| TVA | |||||||
| Collectée | 4 280 € | 4 280 € | 4 280 € | 4 280 € | 12 840 € | = 0% | — |
| Déductible | 210 € | 1 640 € | 1 230 € | 1 027 € | 3 080 € | ▲ 14% | |
| Nette à décaisser | 4 070 € | 2 640 € | 3 050 € | 3 253 € | 9 760 € | ▼ 6% | |
| RÉCURRENT | |||||||
| Abonnements | — | 1 340 € | 1 290 € | 877 € | 2 630 € | ▼ 4% | |
| CA récurrent | 21 400 € | 21 400 € | 21 400 € | 21 400 € | 64 200 € | = 0% | — |
Réel = mouvements bancaires importés. Projection (trésorerie) = récurrents. TVA & déductible estimées (cf. module Charges). Récap indicatif.
Toutes les sociétés · consolidé
← Meridian Retail
Meridian Retail · https://meridian-retail.example
Sur août 2026, le site a généré 1 240 visites depuis Google (+38 % par rapport au mois précédent) et 4 810 sessions tous canaux confondus. Les indicateurs ci-dessous détaillent l'acquisition, l'audience, la performance technique et le positionnement.
Search Console mesure la présence du site dans les résultats Google. Les impressions (61 300) correspondent au nombre de fois où le site est apparu, les clics (1 240) aux visites réellement obtenues. Le CTR de 2,0 % indique la part d'internautes qui cliquent après avoir vu le site.
Google Analytics décrit ce que font les visiteurs une fois sur le site. Les sessions (4 810) sont les visites, dont 3 120 nouveaux visiteurs. Le taux d'engagement de 58 % reflète la part de visites actives. Les conversions (86) sont les actions à valeur (contact, demande, achat). Le canal principal est « Organic Search ».
La performance technique influence à la fois l'expérience visiteur et le référencement. Le score mobile est de 74/100 contre 96/100 sur ordinateur. Les Core Web Vitals mesurent le ressenti réel : LCP, CLS et INP. Le vert indique une valeur dans les seuils recommandés par Google.
Notre prestation SEO suit une feuille de route progressive : nous assainissons d'abord les fondations techniques, puis nous optimisons les pages, produisons du contenu ciblé et travaillons enfin la conversion. Ce mois (mois 3 de l'accompagnement) correspond à la phase « Contenu ».
Tendances 2026, guide du concept store, entretien du mobilier — 1 800 mots chacun, maillés entre eux.
Réécriture des 24 pages clés pour intégrer les mots-clés cibles.
Poids divisé par trois sur la page d’accueil ; LCP mobile en amélioration.
Chargement différé des scripts tiers et préchargement de l’image principale.
Sur les requêtes « concept store vs boutique » et « mobilier design pas cher ».
Relier chaque collection aux articles qui la citent pour faire circuler la popularité.
Rapport généré le 03/09/2026 · données réelles du client.
Every company at a glance: MRR, billed, pipeline, overdue tasks, today’s agenda.Inside one company: its sales funnel, files and finance — the same column of modules for each.Monthly cash-basis P&L: actual, current month, projected. Subscriptions and expenses feed the outflows.Actual inflows and outflows, then projection of recurring items; the estimated balance reads on the curve.Expenses by line, VAT collected and deductible, recurring — month by month, with variation and trend.Meetings, tasks and deadlines of every company on one agenda, synced with Google Calendar and reconciled every morning.A client’s SEO report, generated automatically on the 3rd of each month: summary, clicks, impressions, sessions, position.Google data wired in live — queries, pages, sessions, users — explained in plain words for the client.What was done this month, what comes in the following weeks — then “Ready to send” and PDF export.
01 / 09What’s underneath
What runs on its own
The result
One tool replaces Notion, Excel, the CRM and the billing app. Everything to run several companies — finance, clients, agenda, reporting — in one place, and client SEO reports generate themselves every month. Started on 4 June 2026, it has run every day since. Proof that we can build the exact tool a business needs.
M-003B2B SaaS · Legal
The problem
For a law firm, drafting deeds and reviewing its client companies’ legal files took a considerable amount of time, file after file, across separate documents and tools.
What we delivered
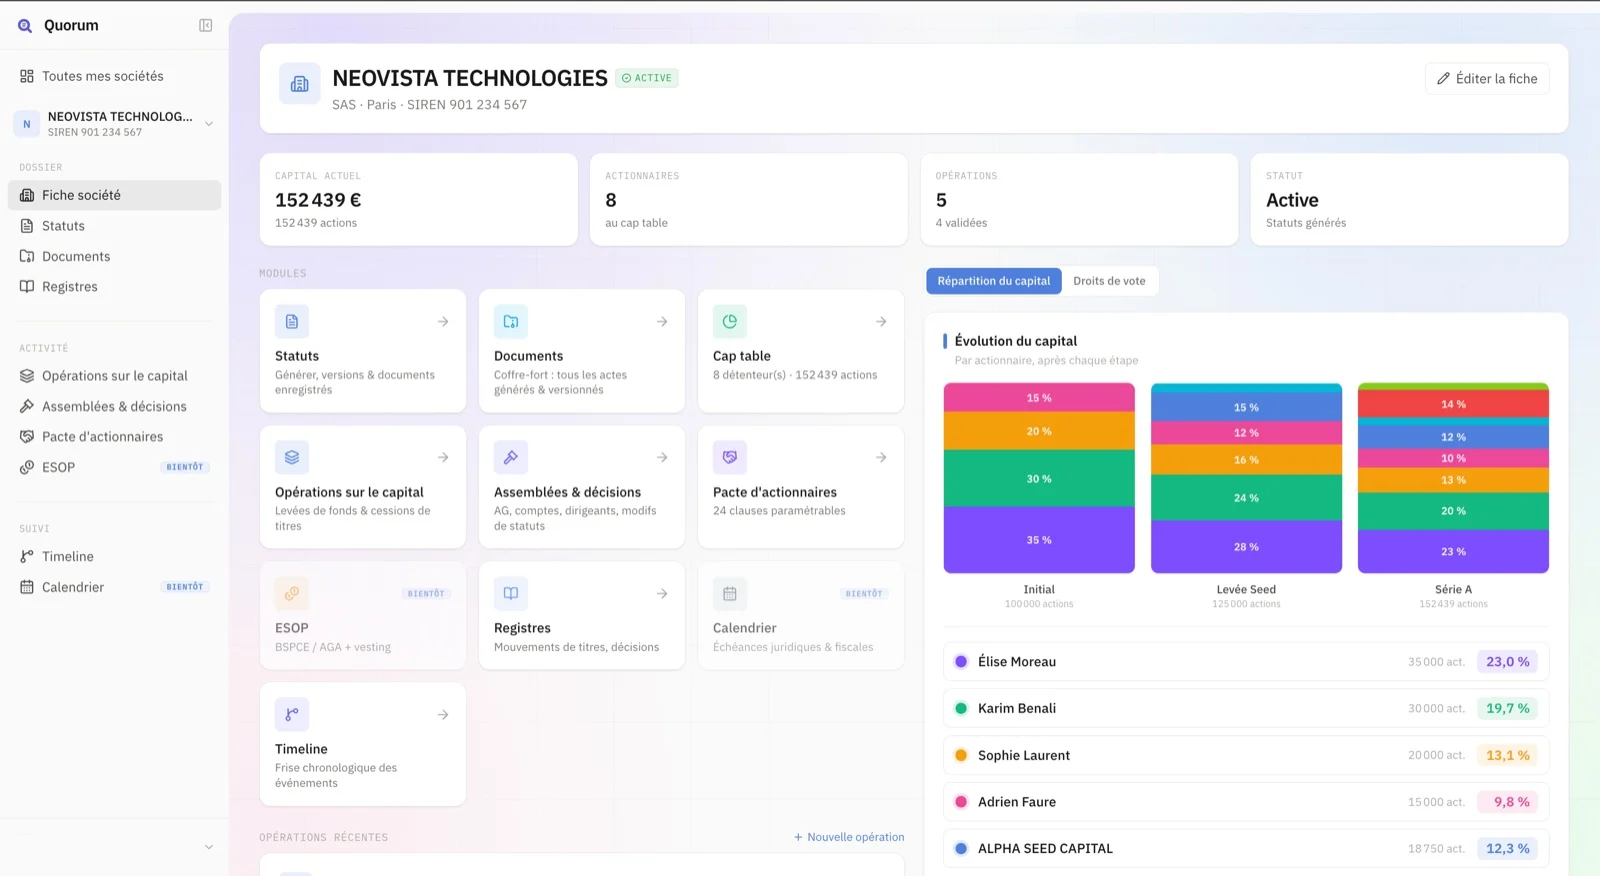
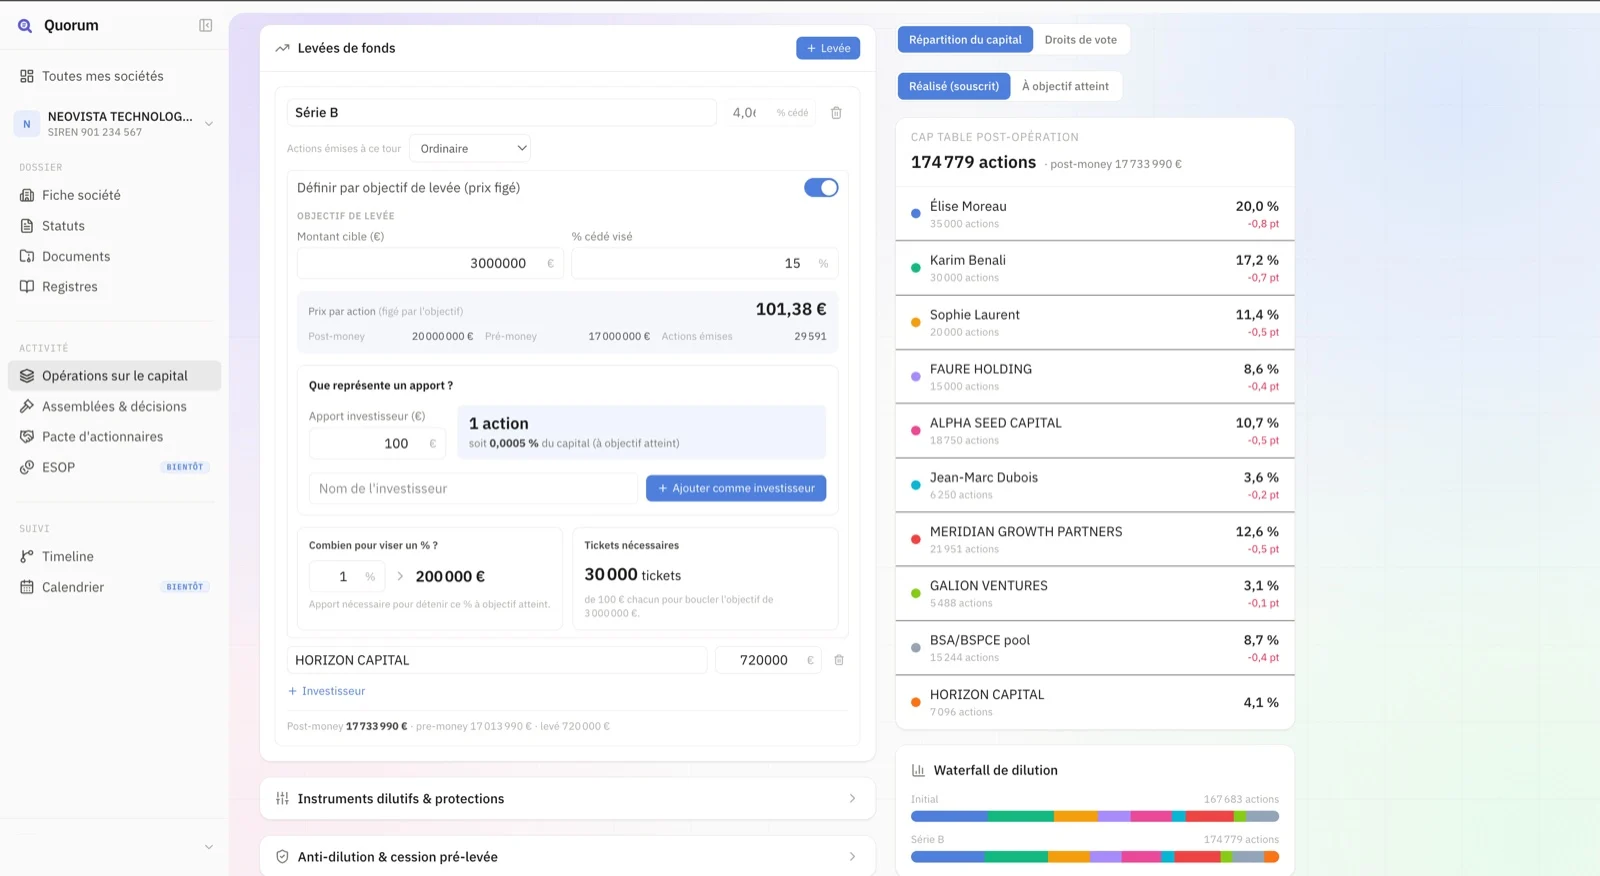
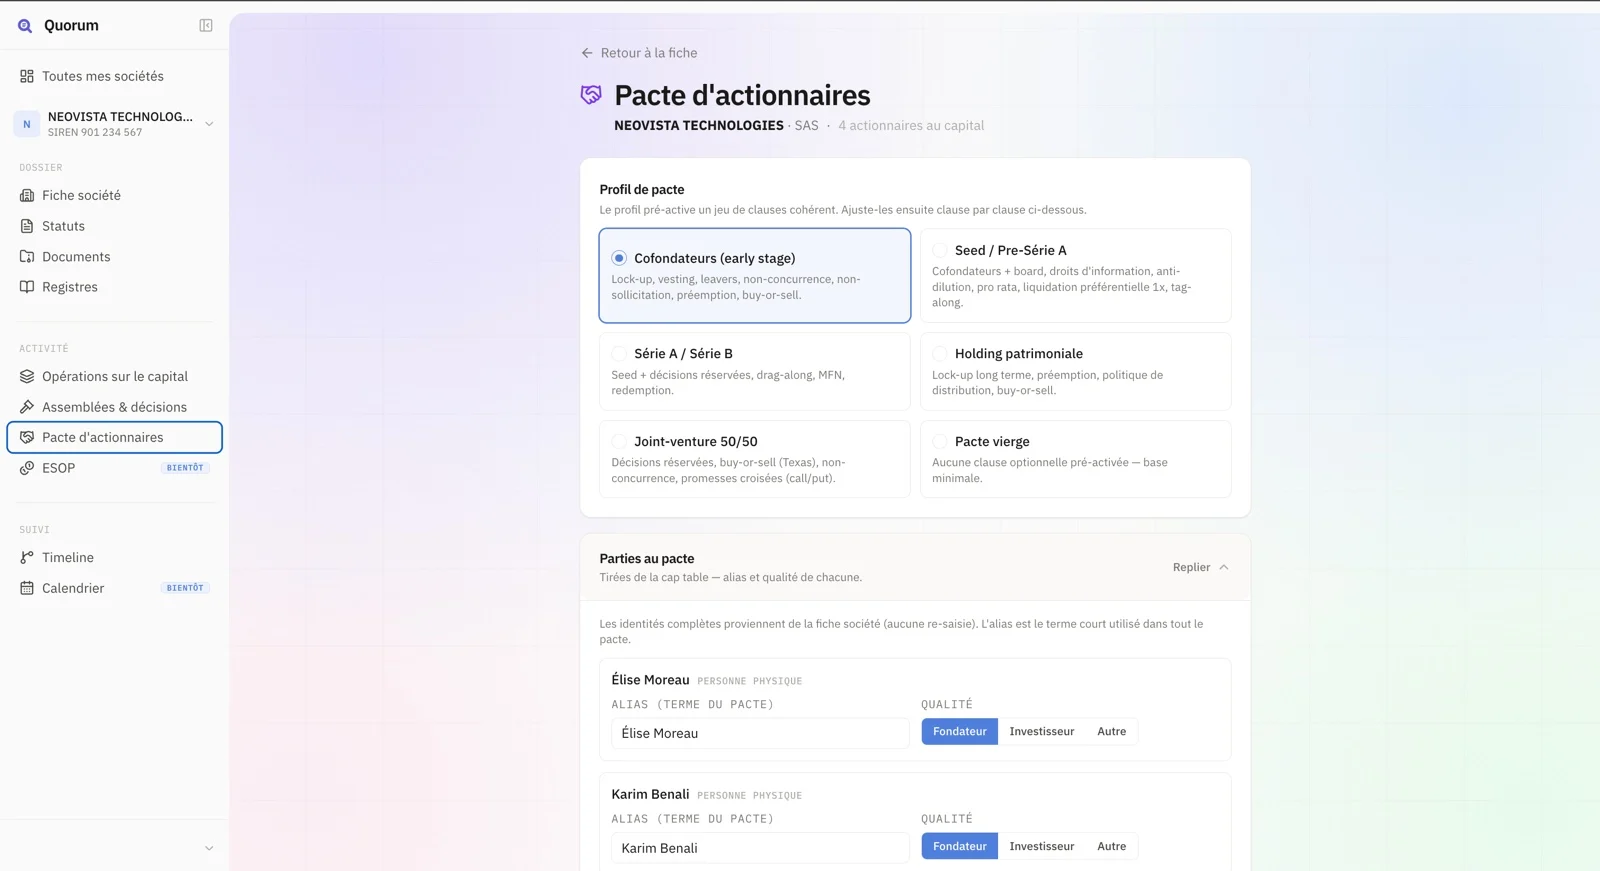
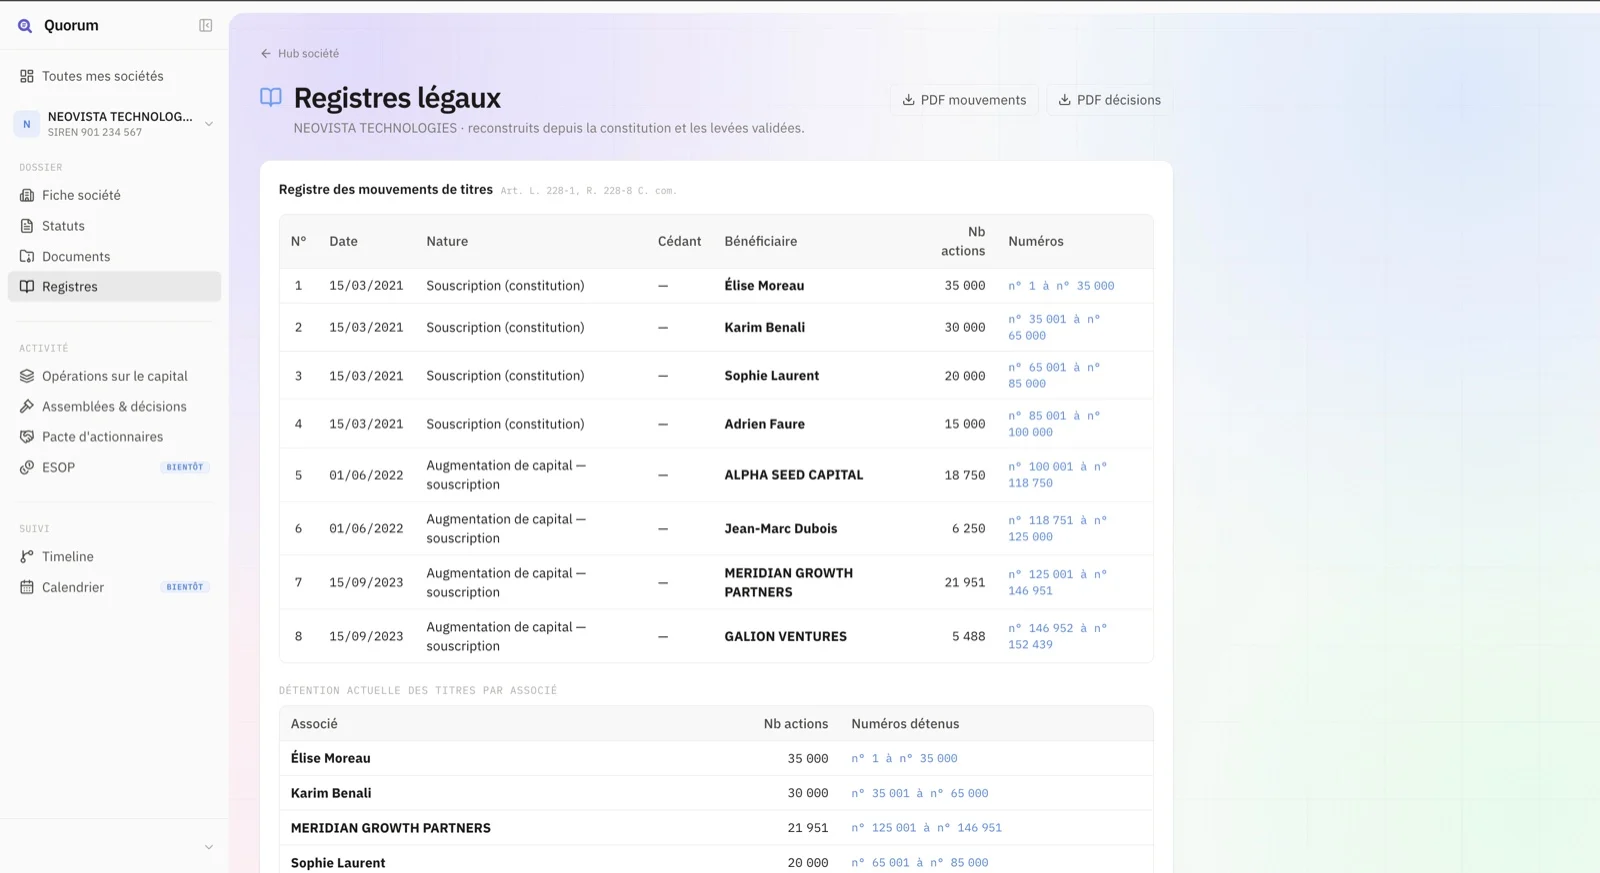
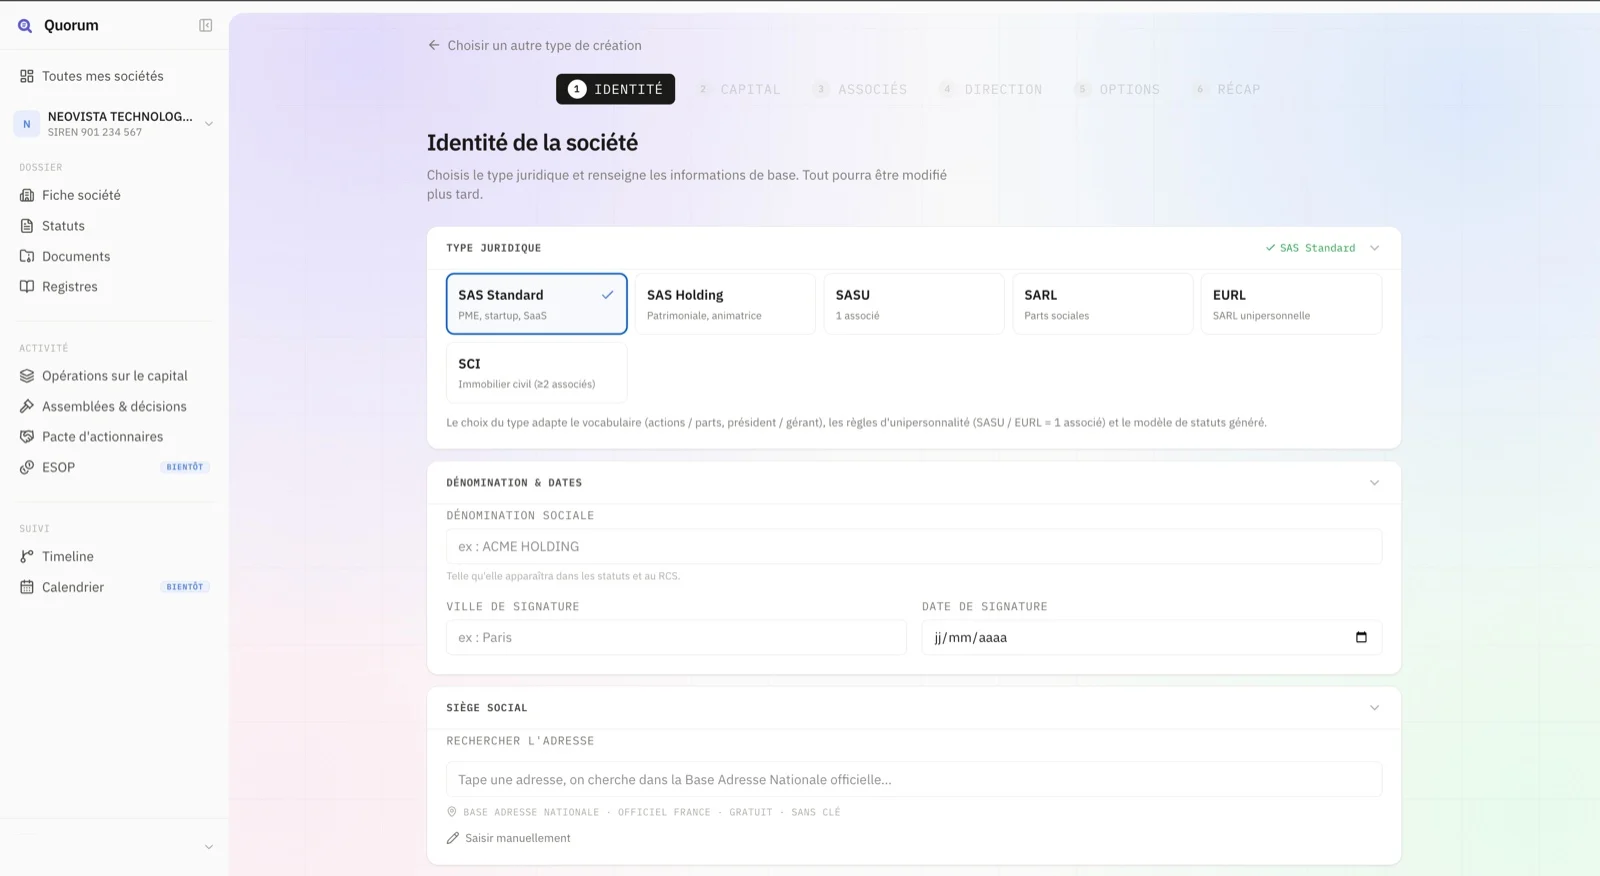
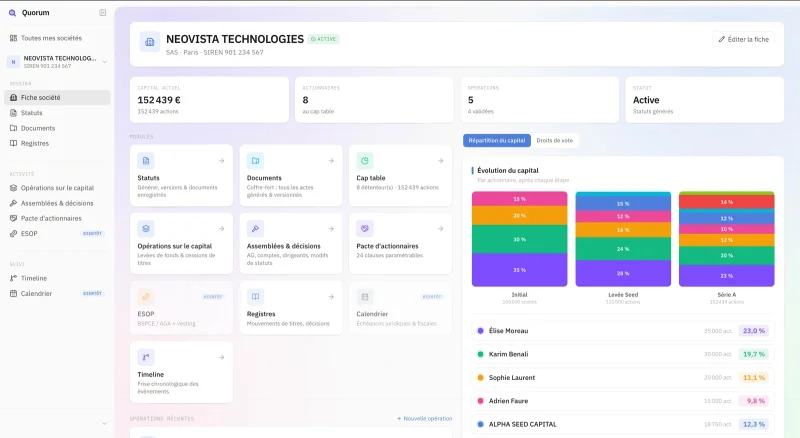
We built for this firm an AI-driven SaaS that brings deals, clients, cap tables, shareholder agreements and deed generation into one tool. The firm enters an operation once; registers, cap table and deeds keep themselves up to date.


Company profile & capitalFundraising & cap tableShareholder agreementLegal registersAI deed generation
01 / 05The result
Delivered in June 2026 and used by the firm ever since. Its feedback: a considerable time saving on drafting and file review. No figure here: we only publish what has been measured.
The problem
A sonographer-midwife with no online presence: no site to showcase the practice and background, and no simple way for patients to book.
What we delivered
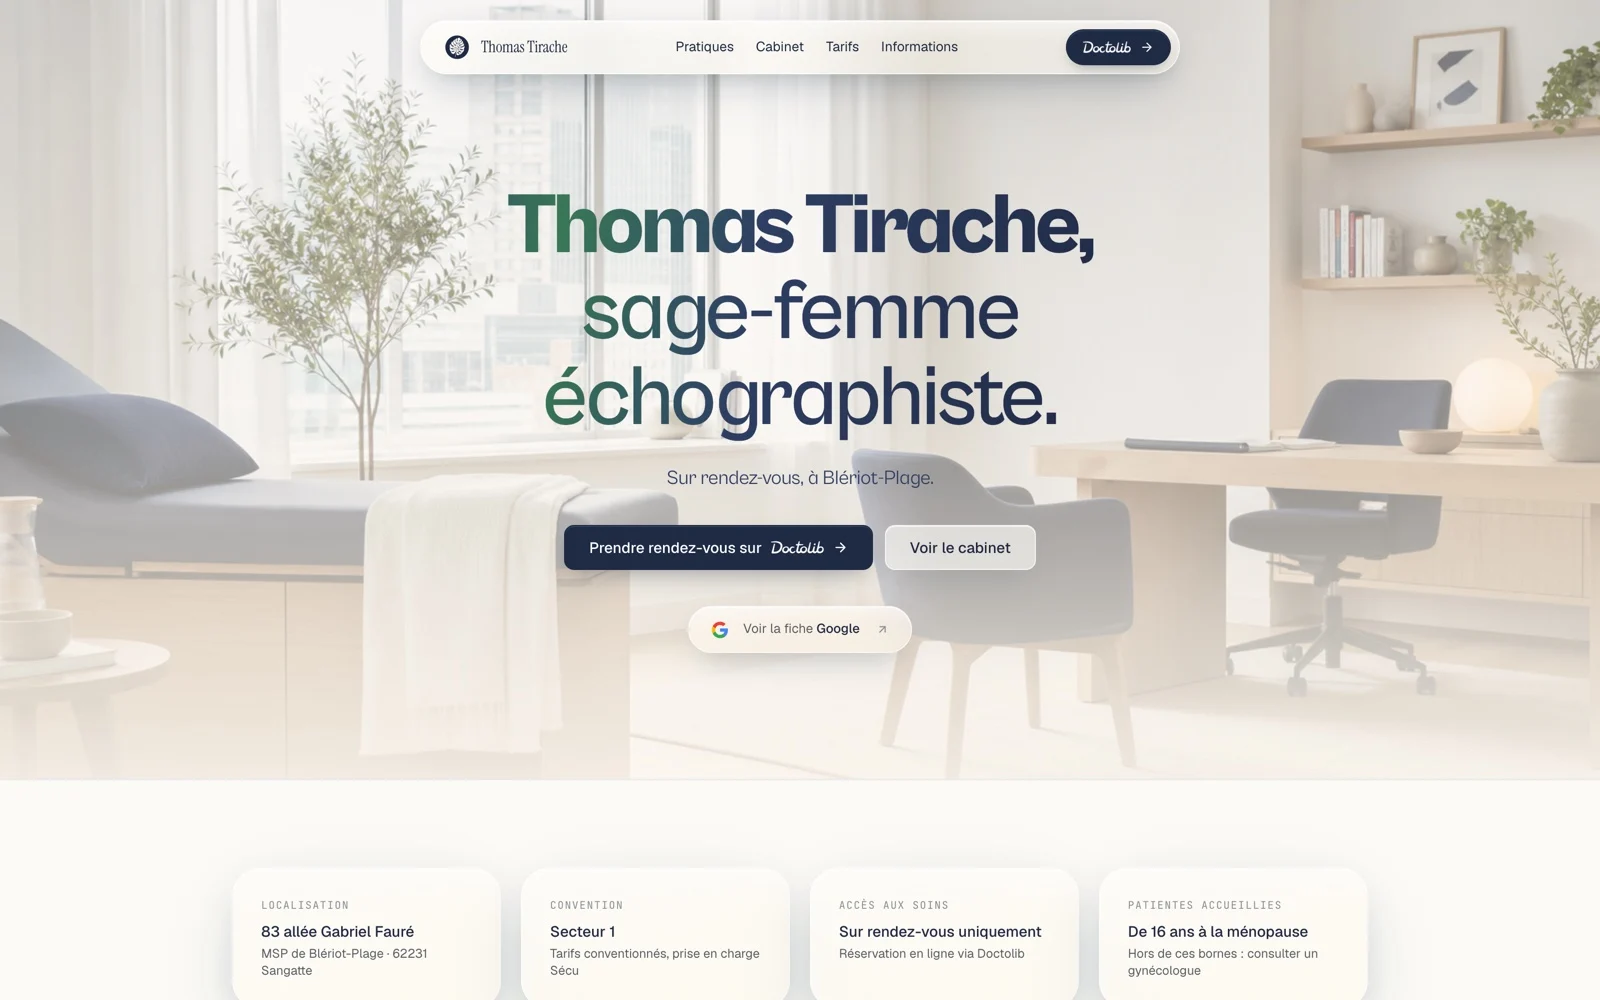
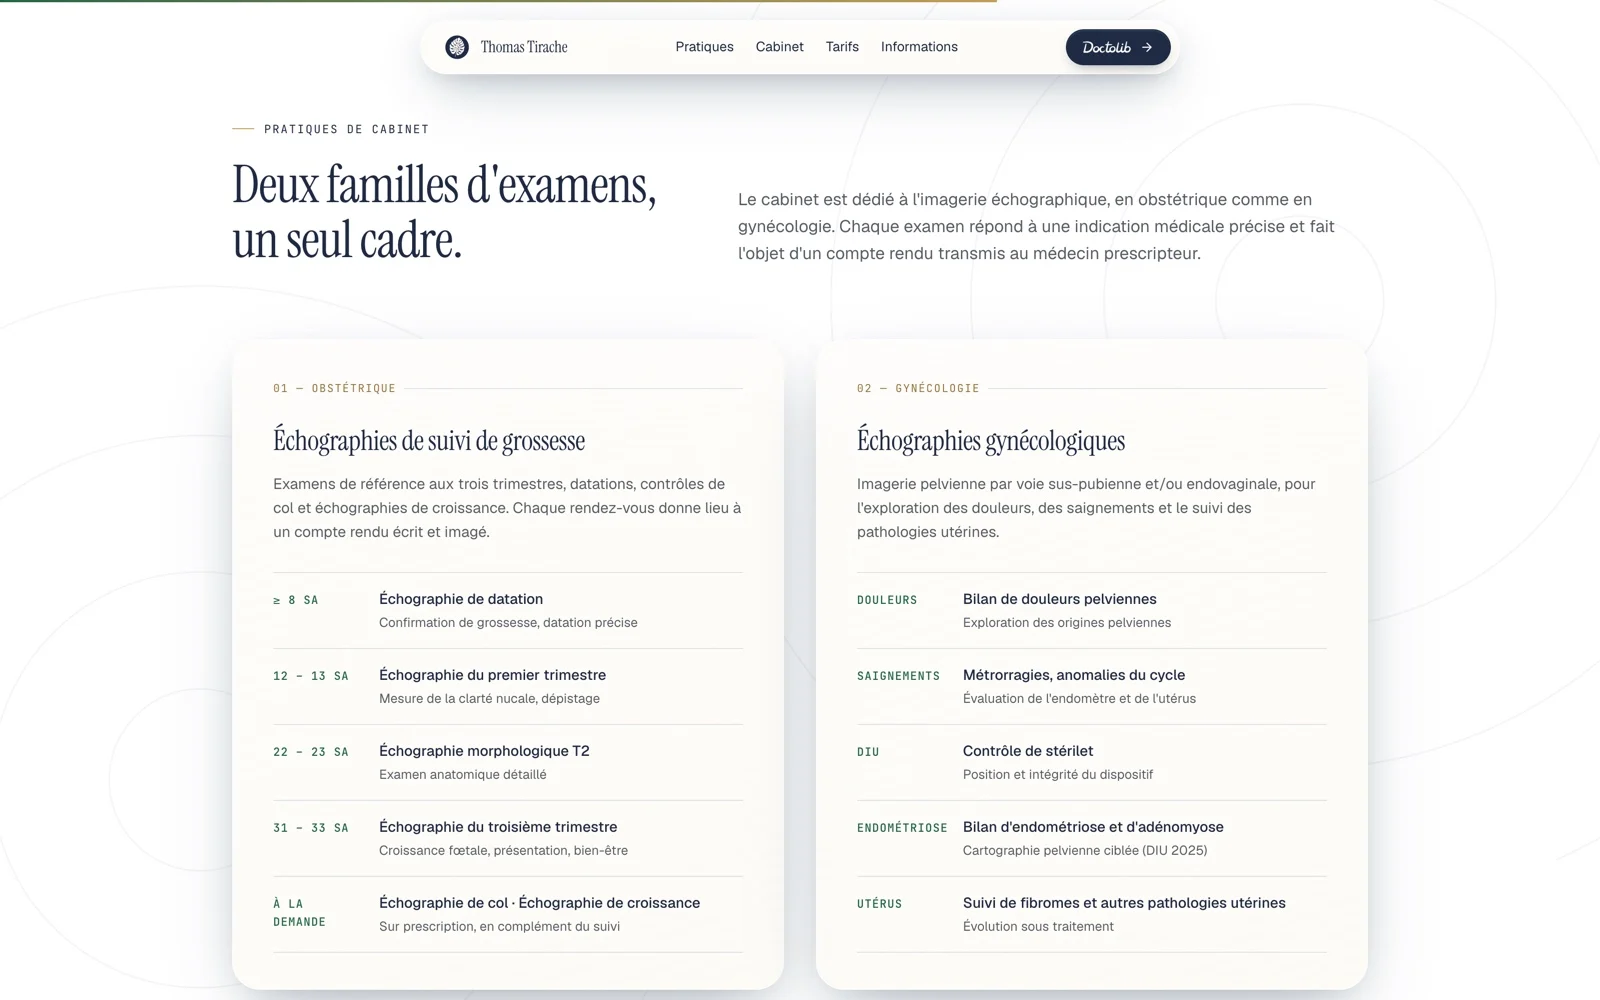
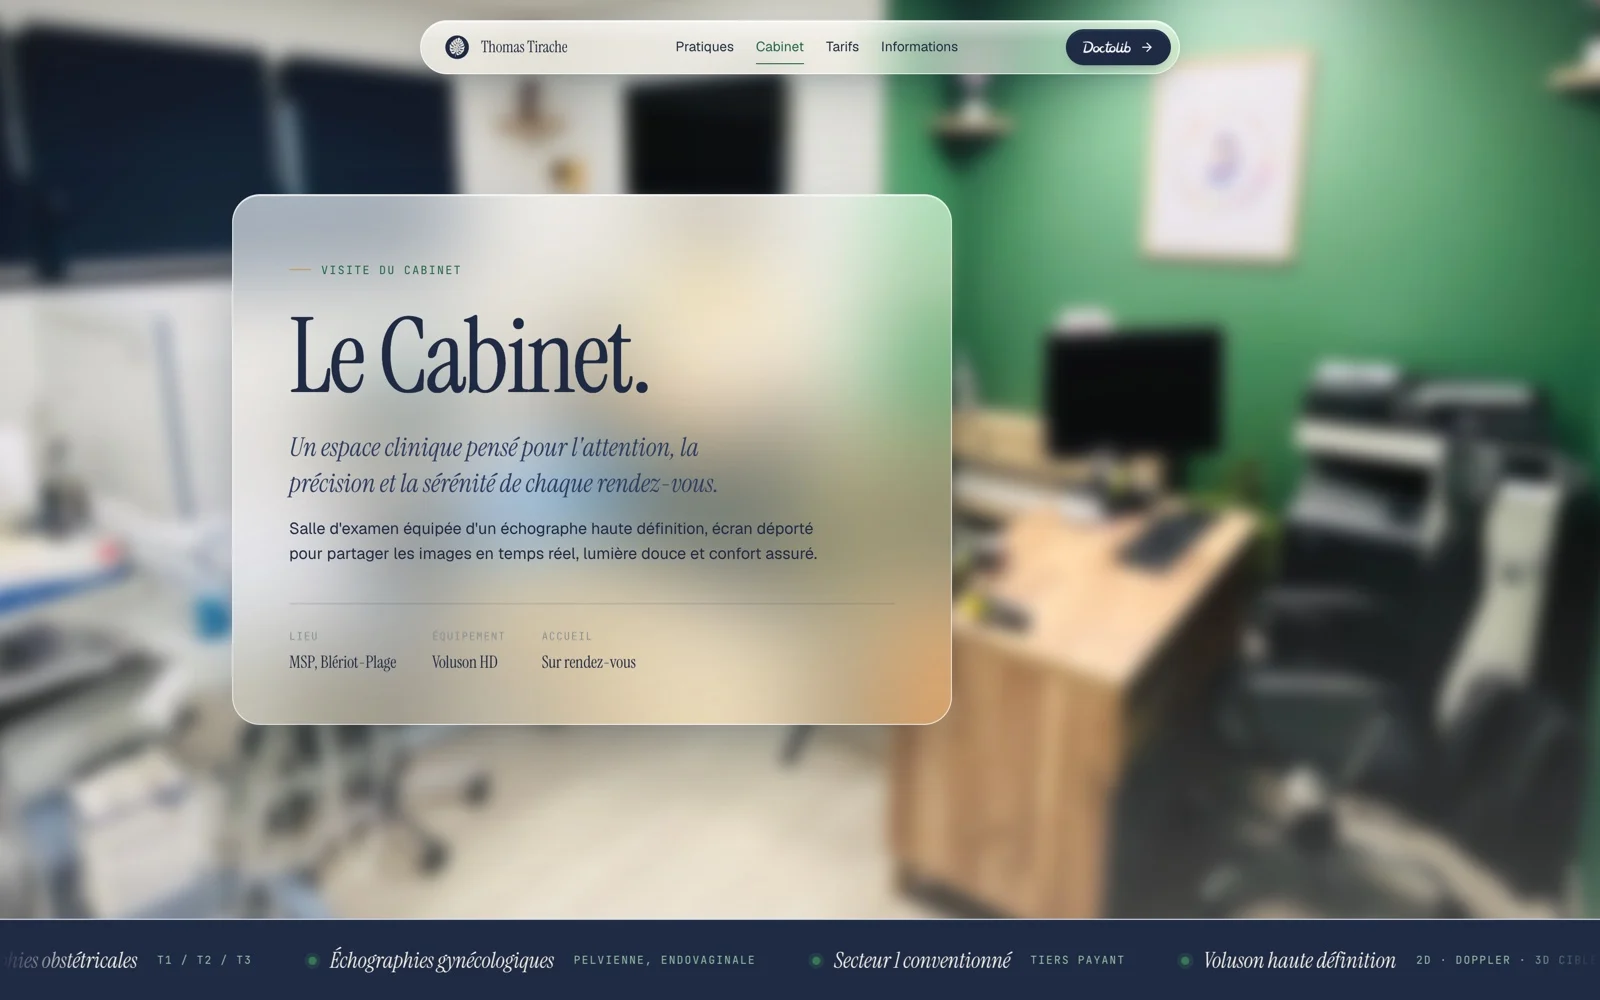
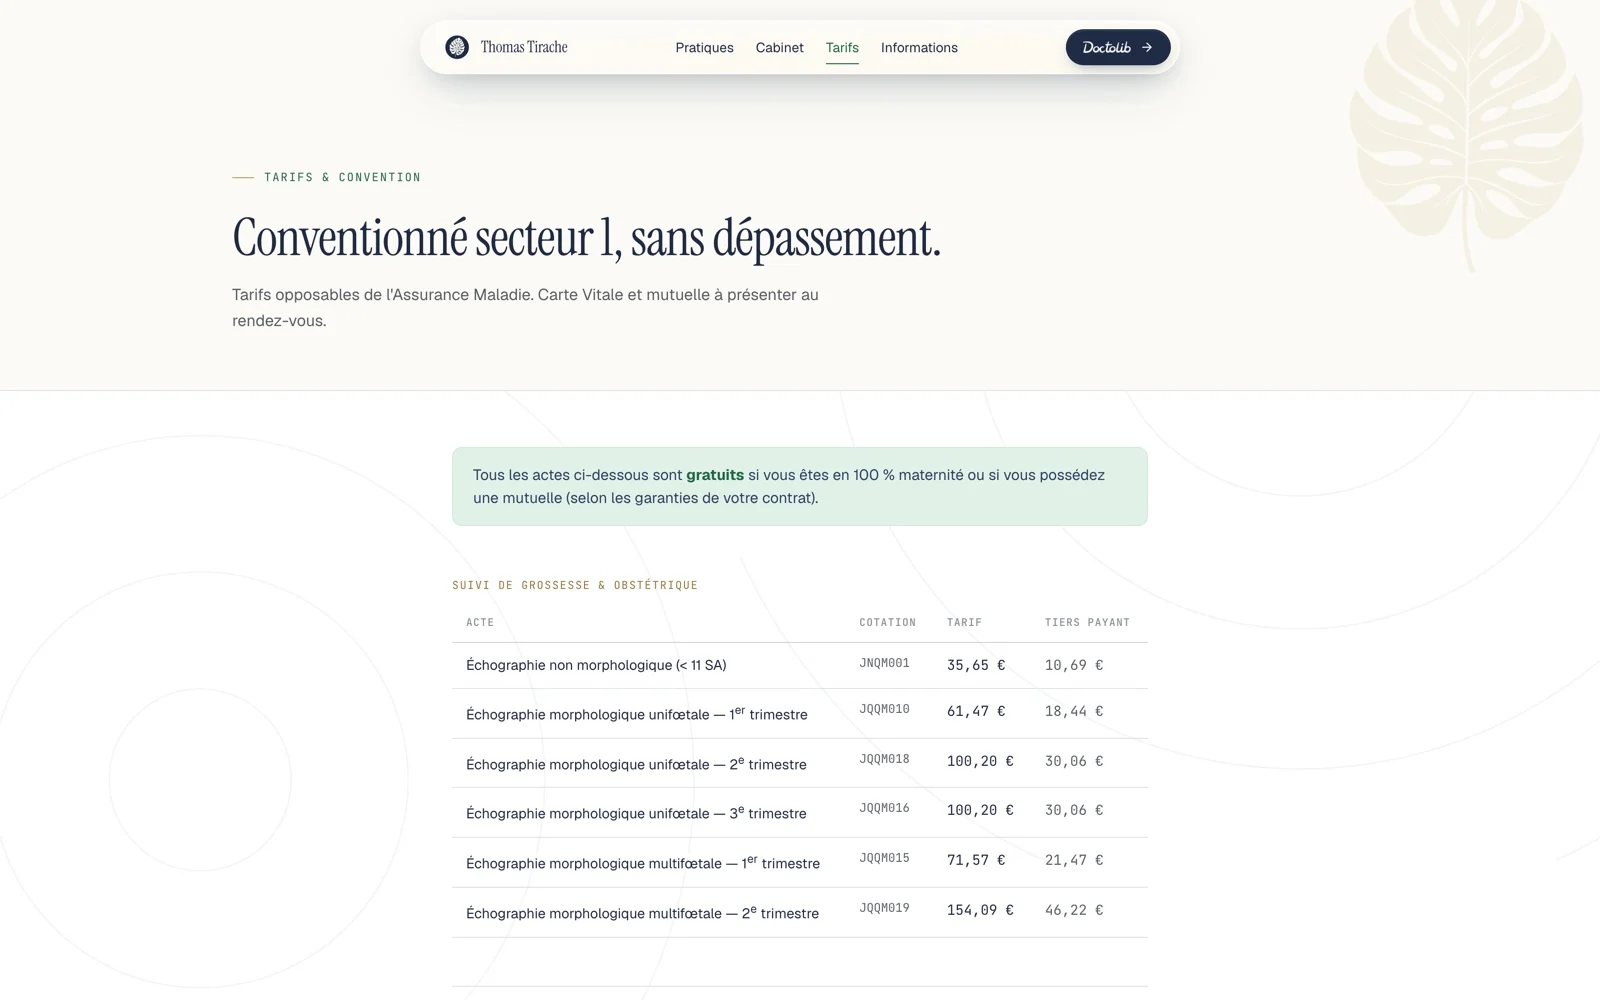
A modern, reassuring marketing site — background, exams, practice and pricing laid out clearly — with online booking built in via Doctolib.


Home pageBackground & examsThe practicePricing & coveragePractical info & booking
01 / 05The result
Site delivered in one to two weeks, with online booking via Doctolib. The practice has a site that fits it, available around the clock.
Honestly, I’m a huge fan of the result — it really hits. Can’t wait to see it live.
Start
Describe the project in a few minutes. We come back with an honest first read, a ballpark and the first risks. No PowerPoint, just a clear answer.